


Key Takeaways
- Bitcoin plunged to $93K as Fed rate cut odds dropped from 60% to 40%, triggering risk-off sentiment.
- Over $617M in crypto liquidations hit the market, with $242M tied to Bitcoin and $169M to Ethereum.
- Spot Bitcoin ETF outflows reached $870M as institutional investors cut exposure amid policy uncertainty.
Bitcoin fell to a low of $93,000 during Asian trading hours on Monday, triggering widespread liquidations across the crypto market. The move followed a sharp drop in expectations for a Federal Reserve rate cut in December. Bitcoin’s decline, the steepest since March, came amid a broader global market sell-off.
The sell-off wiped out $617.45 million in crypto positions within 24 hours. Longs accounted for $394.50 million of that total, while short liquidations made up $222.95 million. Bitcoin itself saw $242.19 million in liquidations, including a single $30.6 million position on Hyperliquid. Ethereum followed with $169.06 million in liquidations.
Market pricing for a December Fed rate cut dropped from 60% to 40% in a week, sparking risk-off sentiment. At the time of writing, Bitcoin trades at $95,081, down 0.85% in 24 hours, with the total crypto market cap shrinking to $3.31 trillion.
ETF Outflows and Global Market Weakness Add Pressure
Investors exited risk assets following hawkish commentary from Federal Reserve officials. Fed Chair Jerome Powell said a rate cut was “far from a foregone conclusion,” and Boston Fed President Susan Collins emphasized a cautious approach without signs of labor market weakness.
The shift in policy expectations also triggered major outflows from crypto exchange-traded products. Spot Bitcoin ETFs saw $870 million in net outflows, the second-largest withdrawal on record. These institutional moves deepened selling pressure as crypto volumes thinned during Asia’s trading hours.
Meanwhile, global equities mirrored crypto’s decline. U.S. indices posted heavy losses last week, with the Nasdaq falling 2.29%. Europe followed with broad losses in the DAX, FTSE 100, and CAC 40, while Asian indices like the Nikkei and ASX 200 dropped sharply.
Technical Structure Signals Further Downside Risks
Despite the correction, Bitcoin’s technical chart still shows long-term support. The asset has dipped below the 50-week simple moving average, with the next support zones near the 100-week SMA at $87,000 and the April low at $74,000.
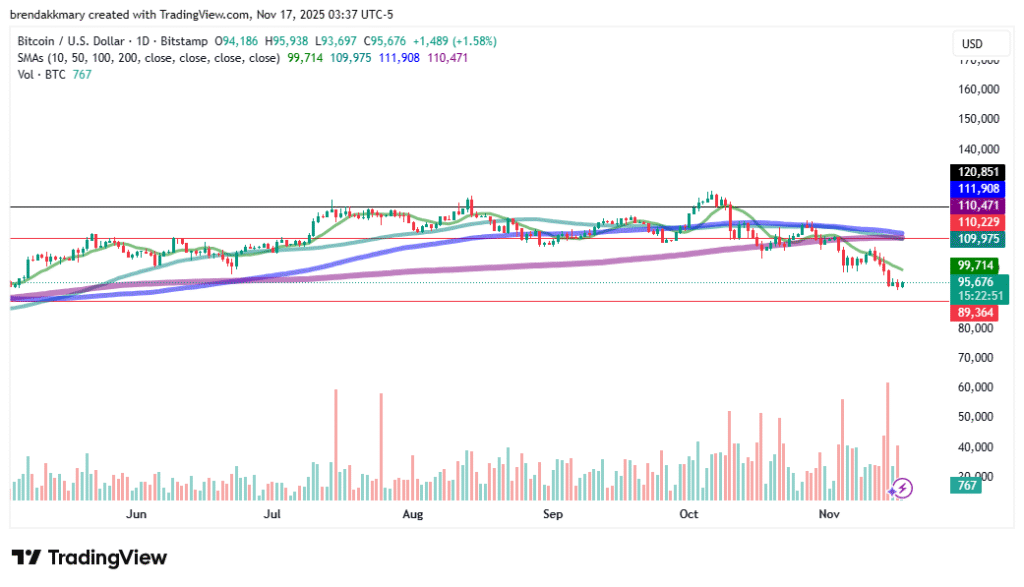
The recent breakdown of a head and shoulders pattern also suggests a bearish target of $89,407, indicating a potential 13.6% decline from its recent highs. If sentiment worsens, Bitcoin could slip toward $90,000 before finding relief.
However, analysts note that accumulation at lower levels could spark a rebound. A sustained move above $100,000 would invalidate the bearish setup and may push Bitcoin toward $105,000, marking a possible reversal of the recent downturn.