


- Solana trades at $143.20 with support holding steady.
- Weekly technicals indicate $186 as the next resistance target.
- Futures data show mixed sentiment, signaling cautious market conditions.
Solana (SOL) remains strong in the cryptocurrency market, trading at $143.20, up 1.5% over the last 24 hours. The range of the token in a day has been between $139.68 and $146.14, which is an indication of positive growth. According to analysts, Solana’s support levels remain intact and provide a platform for further development.
SOL weekly price movement and technicals
Solana has increased by 1.2% over the last seven days, whereas its 14-day analysis demonstrates 1.4% growth, which is a middle-or-so period. SOL market capitalization is around $80.5 billion, and its 24-hour trading volume is around $5.7 billion, suggesting investor interest.
Solana is being tested at key support and resistance zones using technical analysis. A weekly chart shows that the lower Bollinger Band at $122.92 was tested, suggesting a possible support point. If SOL can stay above this, it may move to the mid Bollinger Band resistance of 186.74. The next level of bullish momentum is the Bollinger Bands upper band at 250.59.
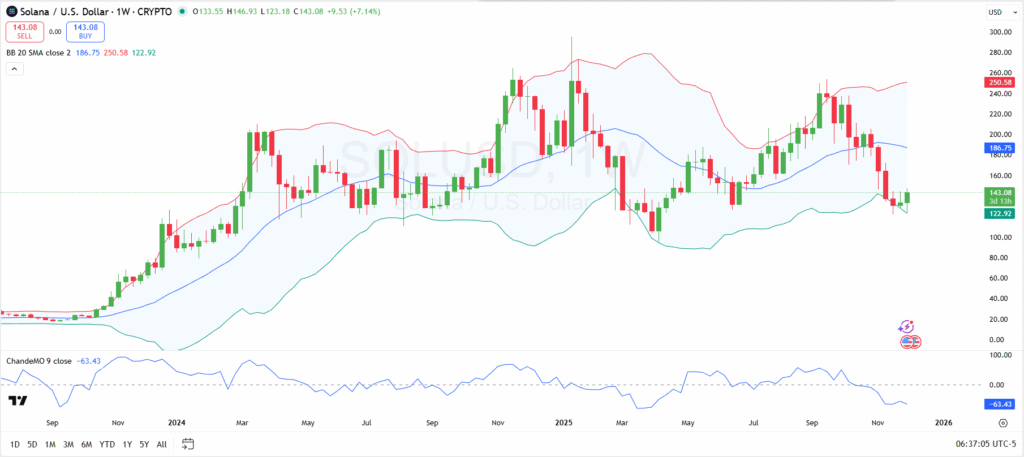
Solana 1 Week Price Chart
CMO signals oversold futures have mixed sentiment
The Chande Momentum Oscillator (CMO) currently stands at -63.43, indicating oversold conditions. An increase above this point could indicate that the declining trend is weakening and may reverse, suggesting that buyers can be overtaken as the trend continues to move in a positive direction.
The futures data of Solana indicate that the sentiment is fluctuating over time. Long positions have increased by 94.57% over the last 4 hours, which is good news for buyers returning, but they are still slightly negative. The short positions exceed the long positions, indicating a temporary equilibrium between the bullish and bearish forces.
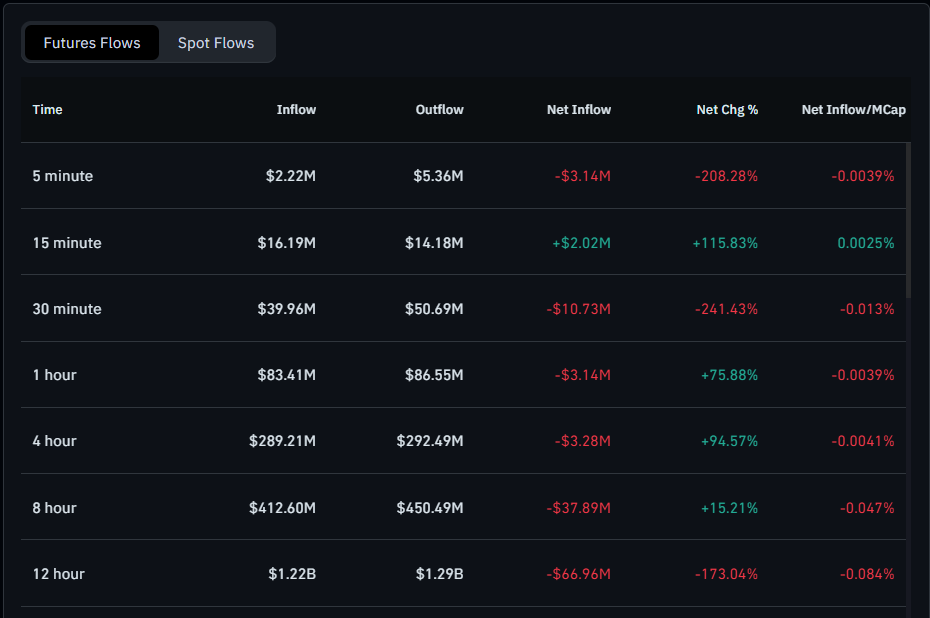
Solana Futures Flow
Futures data reflect cautious trading amid short-term volatility
Over the 8 hours, the growth of long positions was 15.21, but short positions remain preponderant, indicating restraint in trading. The 12-hour window is more bearish, with short positions at 1.29 billion, versus 1.22 billion in long positions. The fact that net long intraday positions decreased suggests the uncertainty of traders or potential profit-taking.
Market observers are interpreting these conflicting future flows as an indication of short-term volatility, and both upward and downward movements are possible depending on investors’ sentiment. Solana’s holding capacity is a factor that will determine whether the token can overcome the $186 resistance zone.